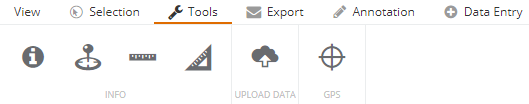
A number of tools are available within the Tools toolbar which allow users to interact with their data.

Information
|
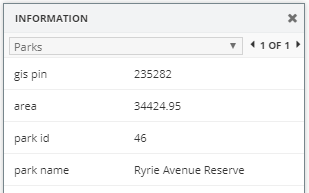
The Information tool is used to retrieve information from the map layers in the map window. The data that the Information Tool can retrieve is limited to the spatial layers, whereas the Selection tools can retrieve data from multiple data sources.
- Click on the Information tool to activate it
- Either click once on the map, or click and hold the left mouse button and drag the cursor away from the point to create a circle
- An information window will display, offering users a drop down for all the different map layers that were selected and their associated attributes
- If multiple features in a layer are selected, users can scroll through them using the arrows on the right of the layer's list
|
|

Coordinates
|
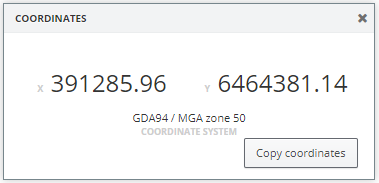
The Coordinates tool is used to return the coordinates of a point on the map window.
- Click on the Coordinates tool to activate it
- Click on a location in the map window
- A coordinates window will display the coordinates of the Coordinate System chosen in the View Toolbar
- Click 'Copy coordinates' to copy the coordinate values to the clipboard
|
|

Measure Distance
|
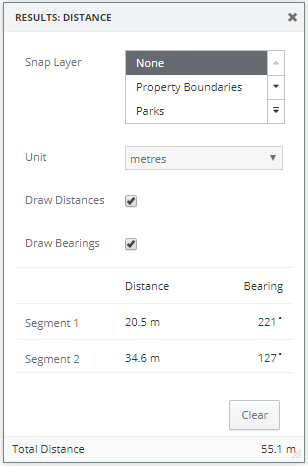
The Measure Distance tool is used to measure a distance on the map.
For higher accuracy, users can activate layer snapping which will force the cursor to snap to a layer whilst measuring.
- Click on the Measure Distance tool to activate it
- A Results: Distance window will display
- Users can choose a snap layer or keep the default at none. The default unit is in metres, but this can be changed to a number of other units
- Draw a line by clicking on the map at various locations. The resulting distance will be displayed on the map as the line is being created
- Double click to complete the line measurement. A total distance will be displayed on the map as well as within the Results window. Users can toggle Draw Distances on/off to view each individual line segment measurement as well as Draw Bearings to view the bearing of each segment
- Measurements will be removed from the map when the Result window is closed
|
|

Measure Area
|
The Measure Area tool is used to measure an area on the map.
For higher accuracy, users can activate layer snapping which will force the cursor to snap to a layer whilst measuring.
- Click on the Measure Area tool to activate it
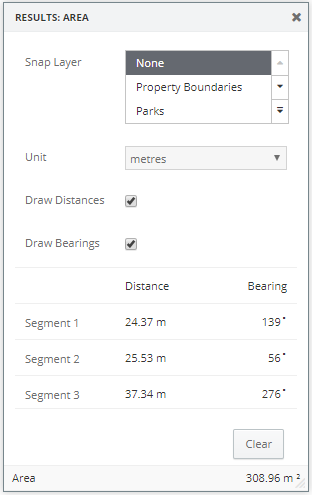
- A Results: Area window will display
- Users can choose a snap layer or keep the default at none. The default unit is in metres, but this can be changed to a number of other units
- Draw a polygon by clicking on the map at various locations. Line segment distances will be displayed on the map as the polygon is being created
- Double click to complete the area measurement. A total area will be displayed on the map as well as within the Results window. Users can toggle Draw Distances on/off to view each individual line segment measurement as well as Draw Bearings to view the bearing of each segment
- Measurements will be removed from the map when the Result window is closed
Note: As mentioned in Polygon Selection, when creating polygons, the last line segment is automatically created, meaning users don't need to finish on the point they started on.
|
|

Upload Data
|
Users can upload vector files directly into a session of IntraMaps and be able to visualise that data within a matter of seconds.
This enables users to quickly and easily visualise a spatial dataset that they have received in one of the supported vector file formats.
- Click on the Upload Data tool to activate it
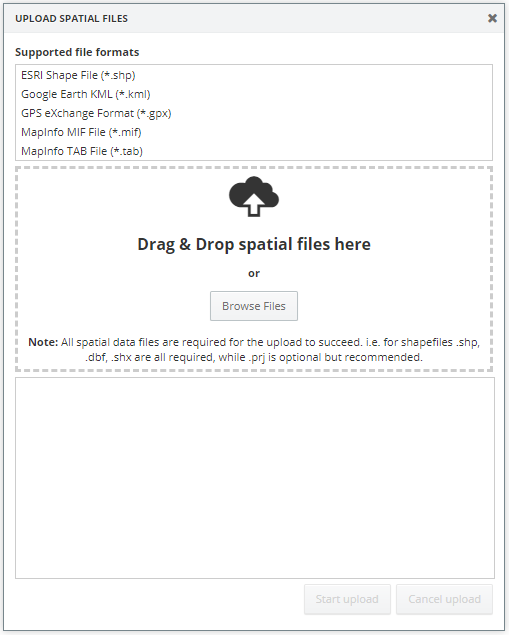
- An Upload Spatial Files window will display
- Users can either drag and drop files into the load area or manually browse for them. Note: All files that make up a single spatial file must be added. For example, to add a shapefile, the .shp, .shx, .dbf files must all be added
- Users can add multiple datasets of different spatial formats, provided they are supported formats
- Click Start upload to begin the upload
- Click Cancel upload to either clear out the selected files or terminate an upload in progress
- Once completed, an Upload Complete message will display and the data will be added to the map, as well as an Uploaded Layers group added to the layer list
- At this point, users can add basic styling the uploaded layers using the same functionality that's available through styling point, line and polygon annotations.
- If the upload was unsuccessful, an Upload Failed message will display
Note: The data will only be available for the current IntraMaps session. If the session is refreshed, the data will be removed.
Some restrictions of the Upload Data function include:
- Limited to datasets of only single geometry types (Points, Lines or Polygons).
- The default file size limit is 20MB.
If users have larger, more complex datasets, they should contact their GIS administrator.
|
|

GPS
|
Enable to the GPS tool to view current GPS location within IntraMaps.
Toggle option: On will display the current location of the user.
Toggle option: Tracking will continue to track and zoom to the users' location and will re-centre the location in the middle of the map if it leaves the map window.
|